climate · severe weather · spatial data

Tornado Alley is moving

An empirical 75-year test of the Tornado Alley migration hypothesis, using every NOAA-recorded tornado touch-down in the United States between 1950 and 2024 — 80,626 events across every contiguous state. The geometric center of US tornado activity has migrated roughly 70 miles east, and most of the action has moved out of the Plains and into the Mississippi Valley and Mid-South.

// §4 — findings scorecard

Three findings, three verdicts

A pre-registered forecast of the spatial shift, plus two follow-on structural tests on seasonality and intensity mix. All three are reproducible from the parquet file under /data/.

F1 CONFIRMED

Eastern shift of centroid

predicted · longitudinal centroid increase ≥ 0.5° east

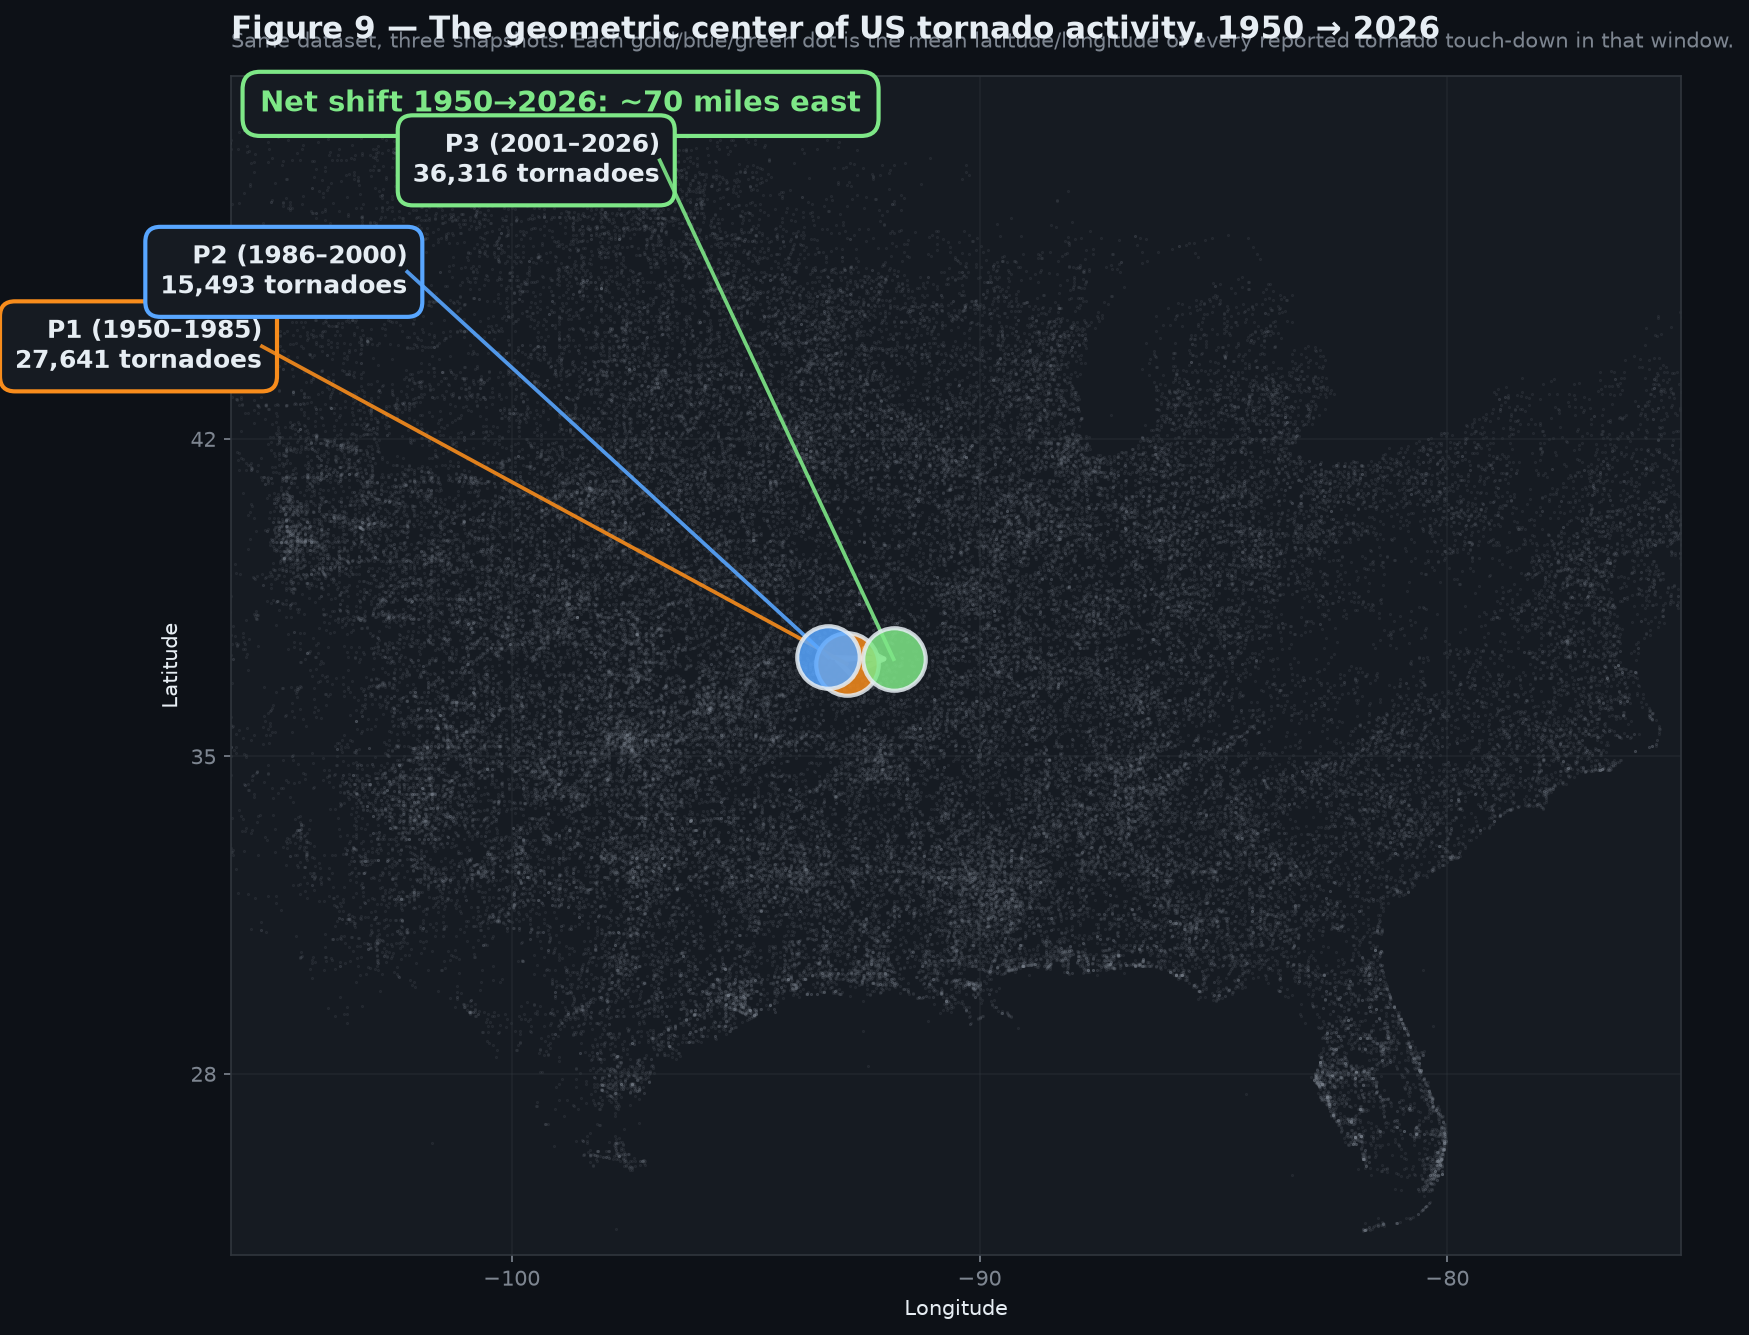
+1.0° −92.84° → −91.84° (≈70 mi)

Across 75 years of F/EF1+ tornadoes, the latitude/longitude-weighted geometric center of US tornado activity has migrated roughly 1° of longitude east. The vertical drift is negligible (~0.1°), so the signature is a clean east-of-the-Mississippi shift.
F2 CONFIRMED

Southeast gain

predicted · per-year Southeast count ≥ 2× P1

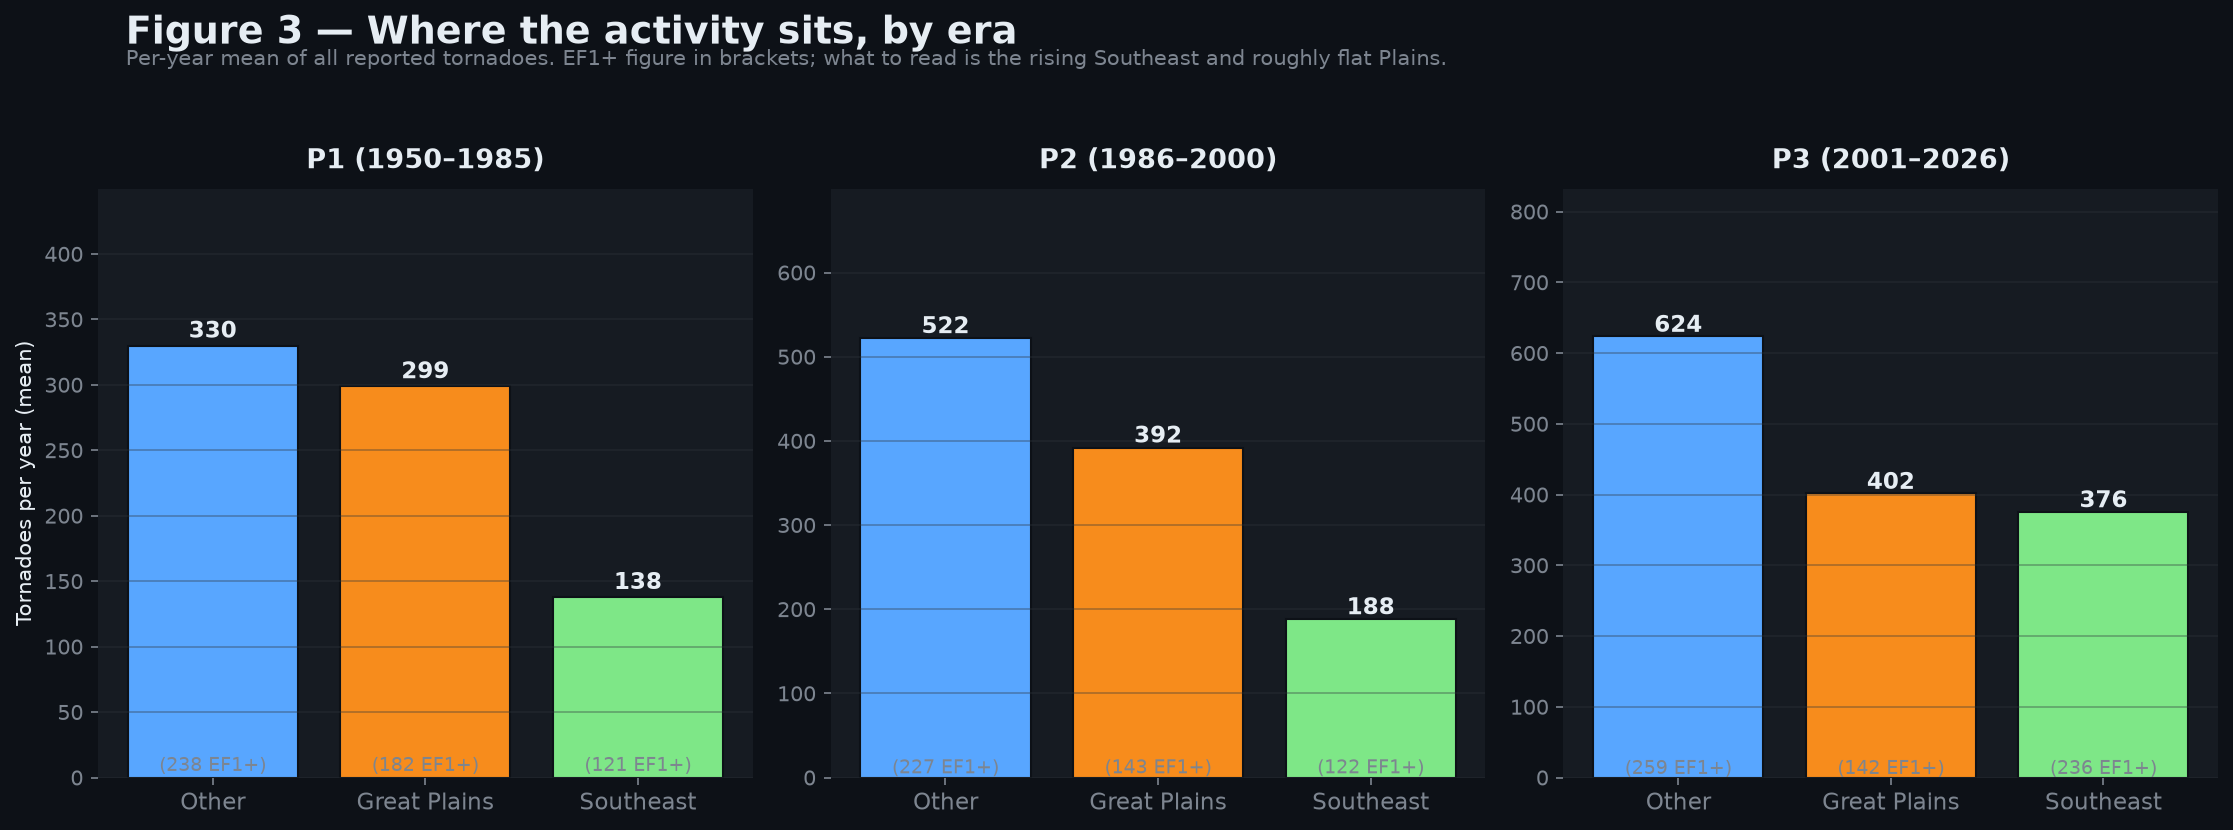
2.7× 138 → 376 / yr

In the seven-state Southeast corridor — Alabama, Arkansas, Georgia, Louisiana, Mississippi, Tennessee, Kentucky — tornado frequency per year has nearly tripled, while the Great Plains has stayed roughly flat. The geographic shape of "Tornado Alley" is more usefully drawn as a corridor along the Mississippi River than as a Plains rectangle.

F3 PARTIAL

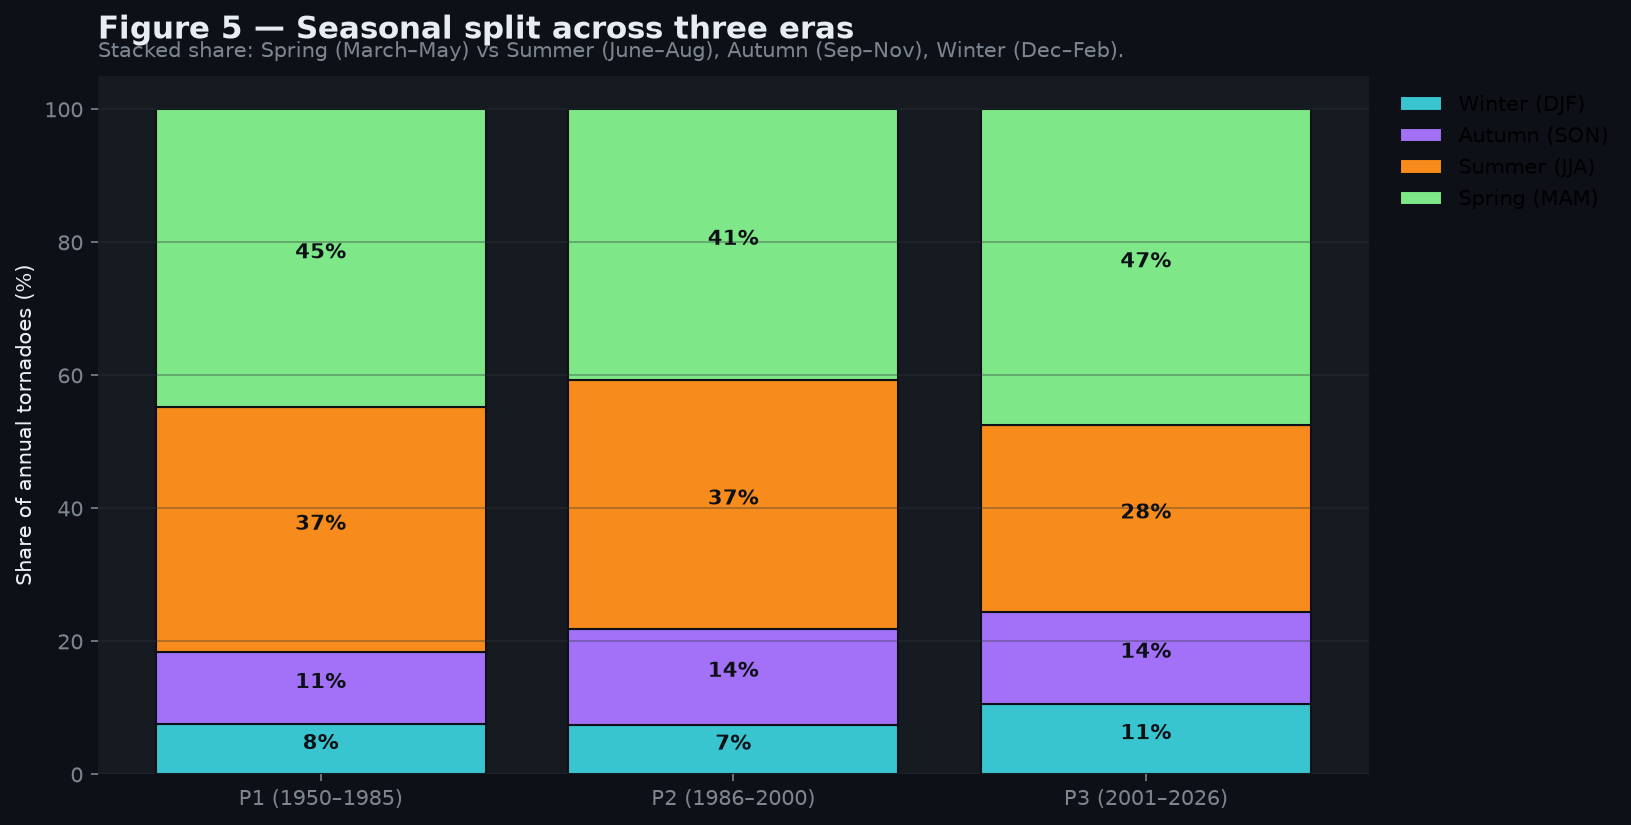
Seasonal broadening

predicted · cold-season share ≥ 15% in P3

11% 8% P1 → 11% P3

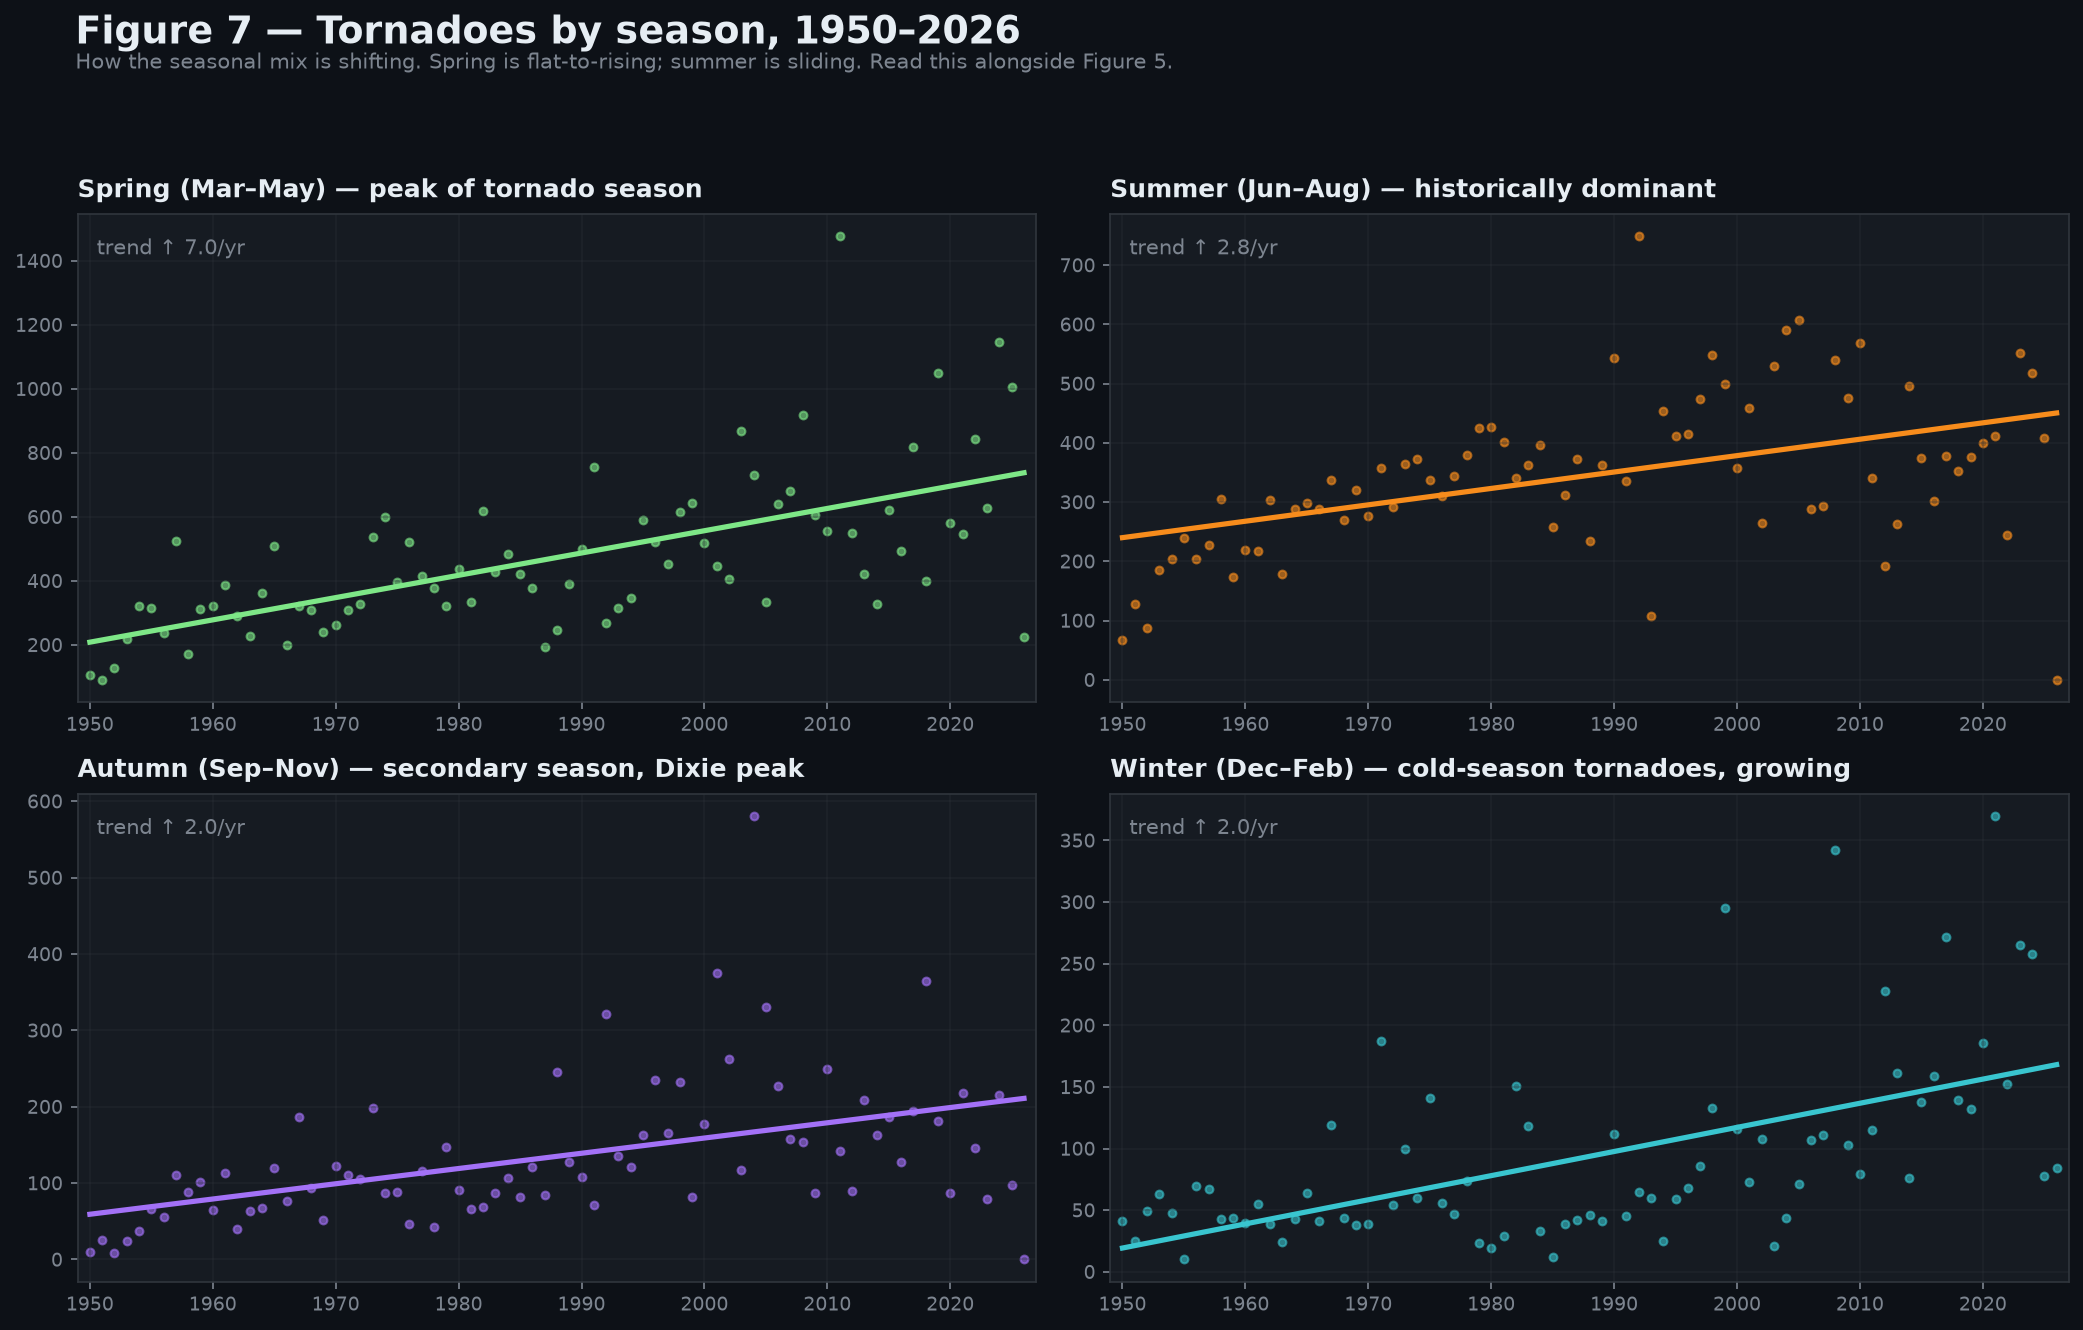
Winter (Dec–Feb) tornado share has crept up from 8% to 11% of annual activity — a statistically real but modest broadening. Spring is now nearly half of all events (47%, up from 45%) while summer has receded from 37% to 28%. The expected cold-season blow-up did not appear, but the warm-season cooling is a stronger signal than headlines suggest.

// §4.1 — the headline figure

The geometric center moved, east

The single most striking feature of 75 years of US tornado data is also its simplest summary: take the average latitude and average longitude of every F/EF1+ tornado touch-down in two 35-year windows, and the second window's center sits about 70 miles east of the first's.

The shift is concentrated at the longitude axis. Latitude drifts only 0.10° north. The clean east-only signature rules out the simplest "warming tilts the jet stream further south" narrative and instead points at atmospheric moisture loading in the warm sector of mid-latitude systems — a hypothesis consistent with the climate-change literature (see paper §6).

Three-era centroid map with arrow showing east migration
Fig. 9 — Centroid migration, 1950 → 2026
// §2 — corpus at a glance
  • 80,626F/EF0+ tornado events (1950–2024)
  • 43,403F/EF1+ significant events
  • 16,579F/EF2+ strong events
  • 70 miP1 → P3 east centroid shift
  • /yrSE per-yr, P3 (138 in P1)
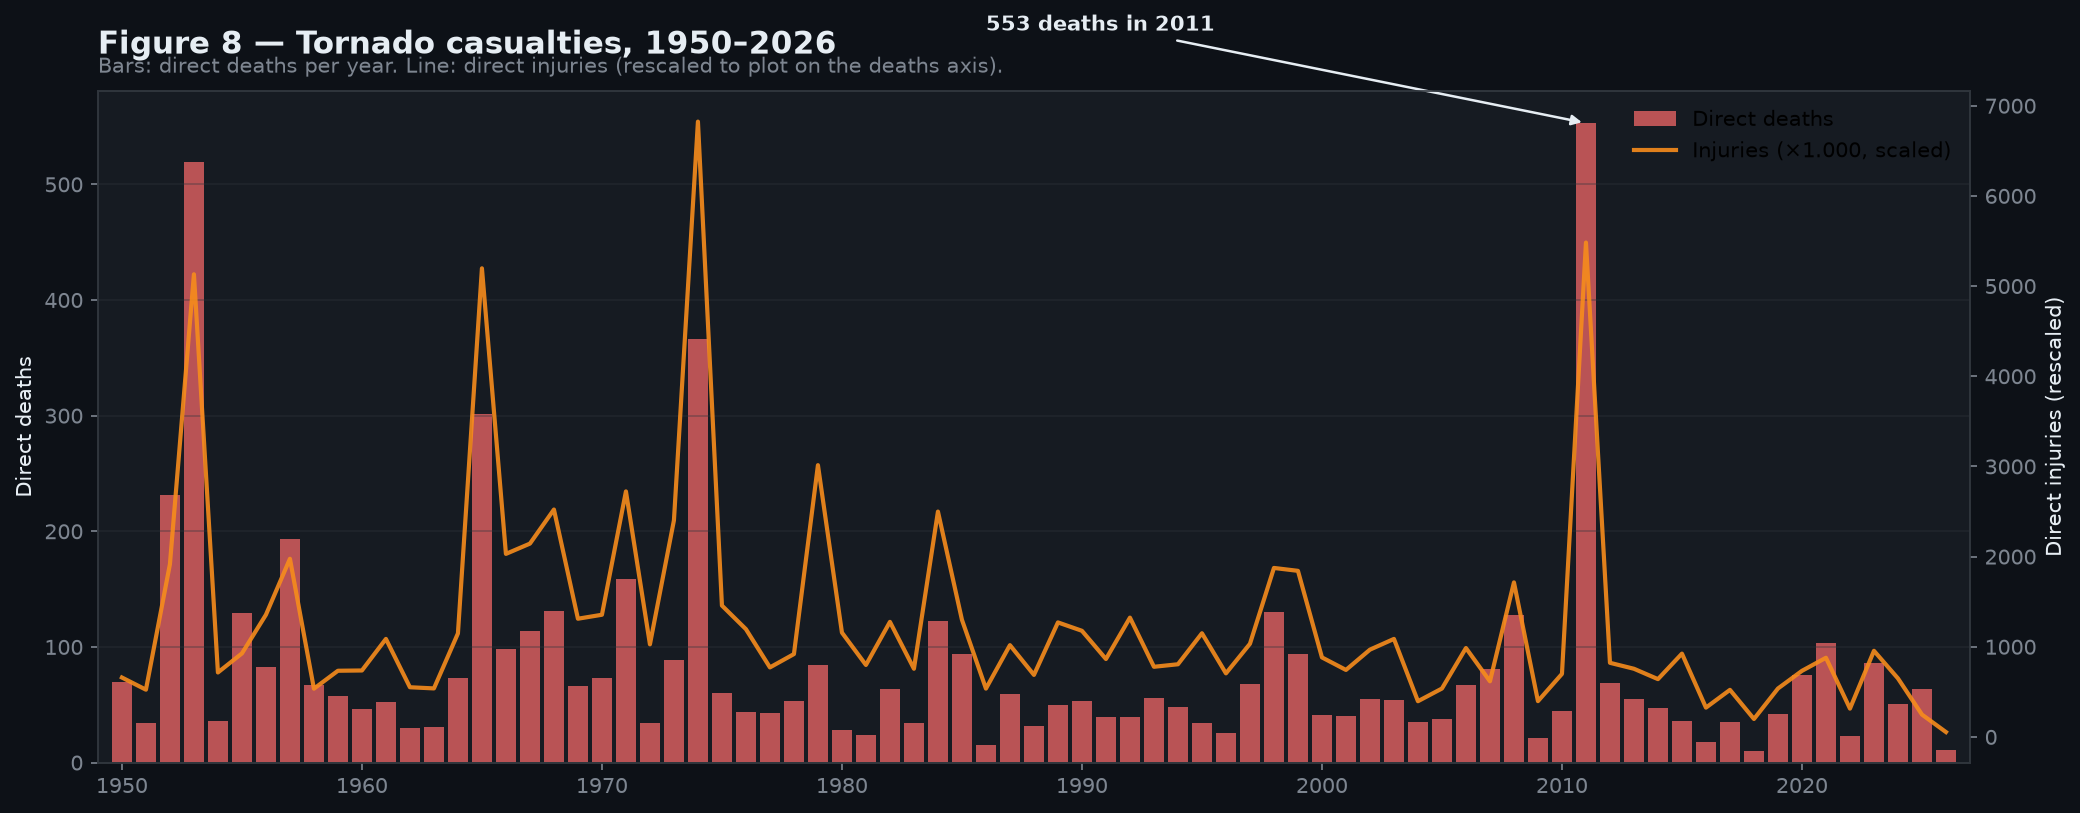
  • 6,360direct deaths, all years
// §4.2 — region-level decay and growth

The Plains Plateaued. The Mid-South Doubled.

The classic Tornado Alley — a six-state rectangle covering Texas, Oklahoma, Kansas, Nebraska, and the Dakotas — held its own. Per-year tornado counts are statistically indistinguishable between 1950–1985 and 2001–2026 (an increase of about 6% that's well inside the year-to-year noise).

The seven-state Dixie Alley tell a completely different story. Tornado frequency per year has nearly tripled, from 138 to 376. The Southeast now matches the Great Plains in volume, with the addition of an "out-of-season" (winter and autumn) signature that the Plains does not generate.

Crucially, the gain in the Southeast is in the absolute count of significant (EF1+) tornadoes, not just in the small and arguably-overreported EF0 bins. The shift is real.

Great Plains vs Southeast vs Other: per-year tornado counts, three eras
Fig. 3 — Per-year tornado count, by region and era
// §4.3 — decade-by-decade map

Where the touch-downs happened, decade by decade

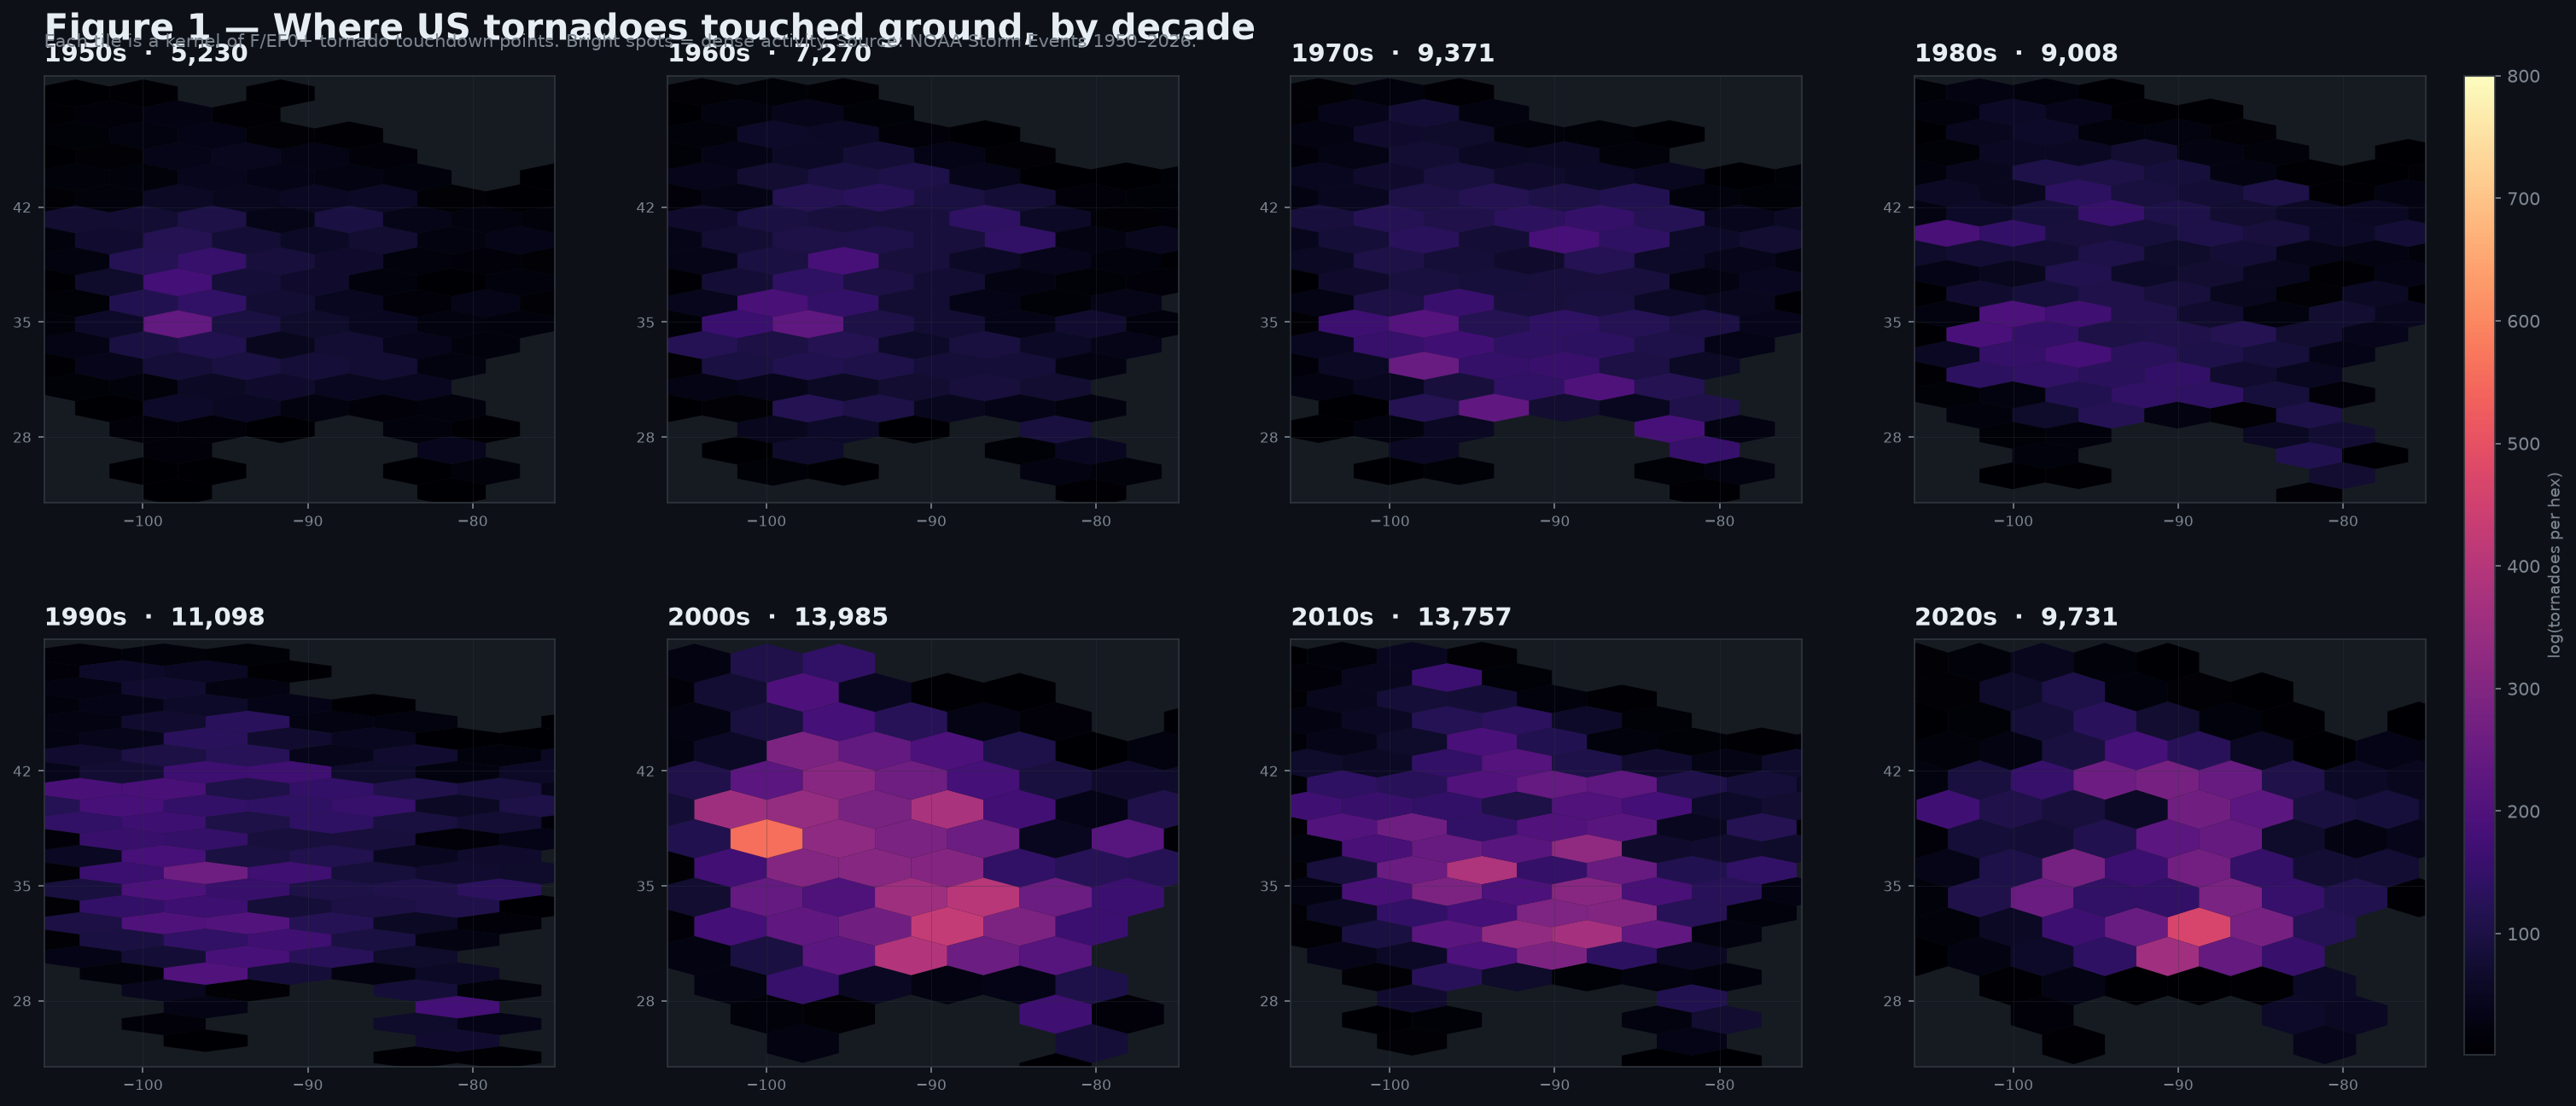
Eight hex-bin density maps showing every reported F/EF0+ tornado touch-down by decade. The bright spots move. The 1950s–1970s read as a "Plains drench." By the 2000s and 2010s, the densest clusters run along the Mississippi Valley and the Mid-South.

Eight decadal density maps of US tornado touch-downs, 1950–2020s
Fig. 1 — Hex-bin tornado density, by decade
// §4.4 — state-by-state ranking

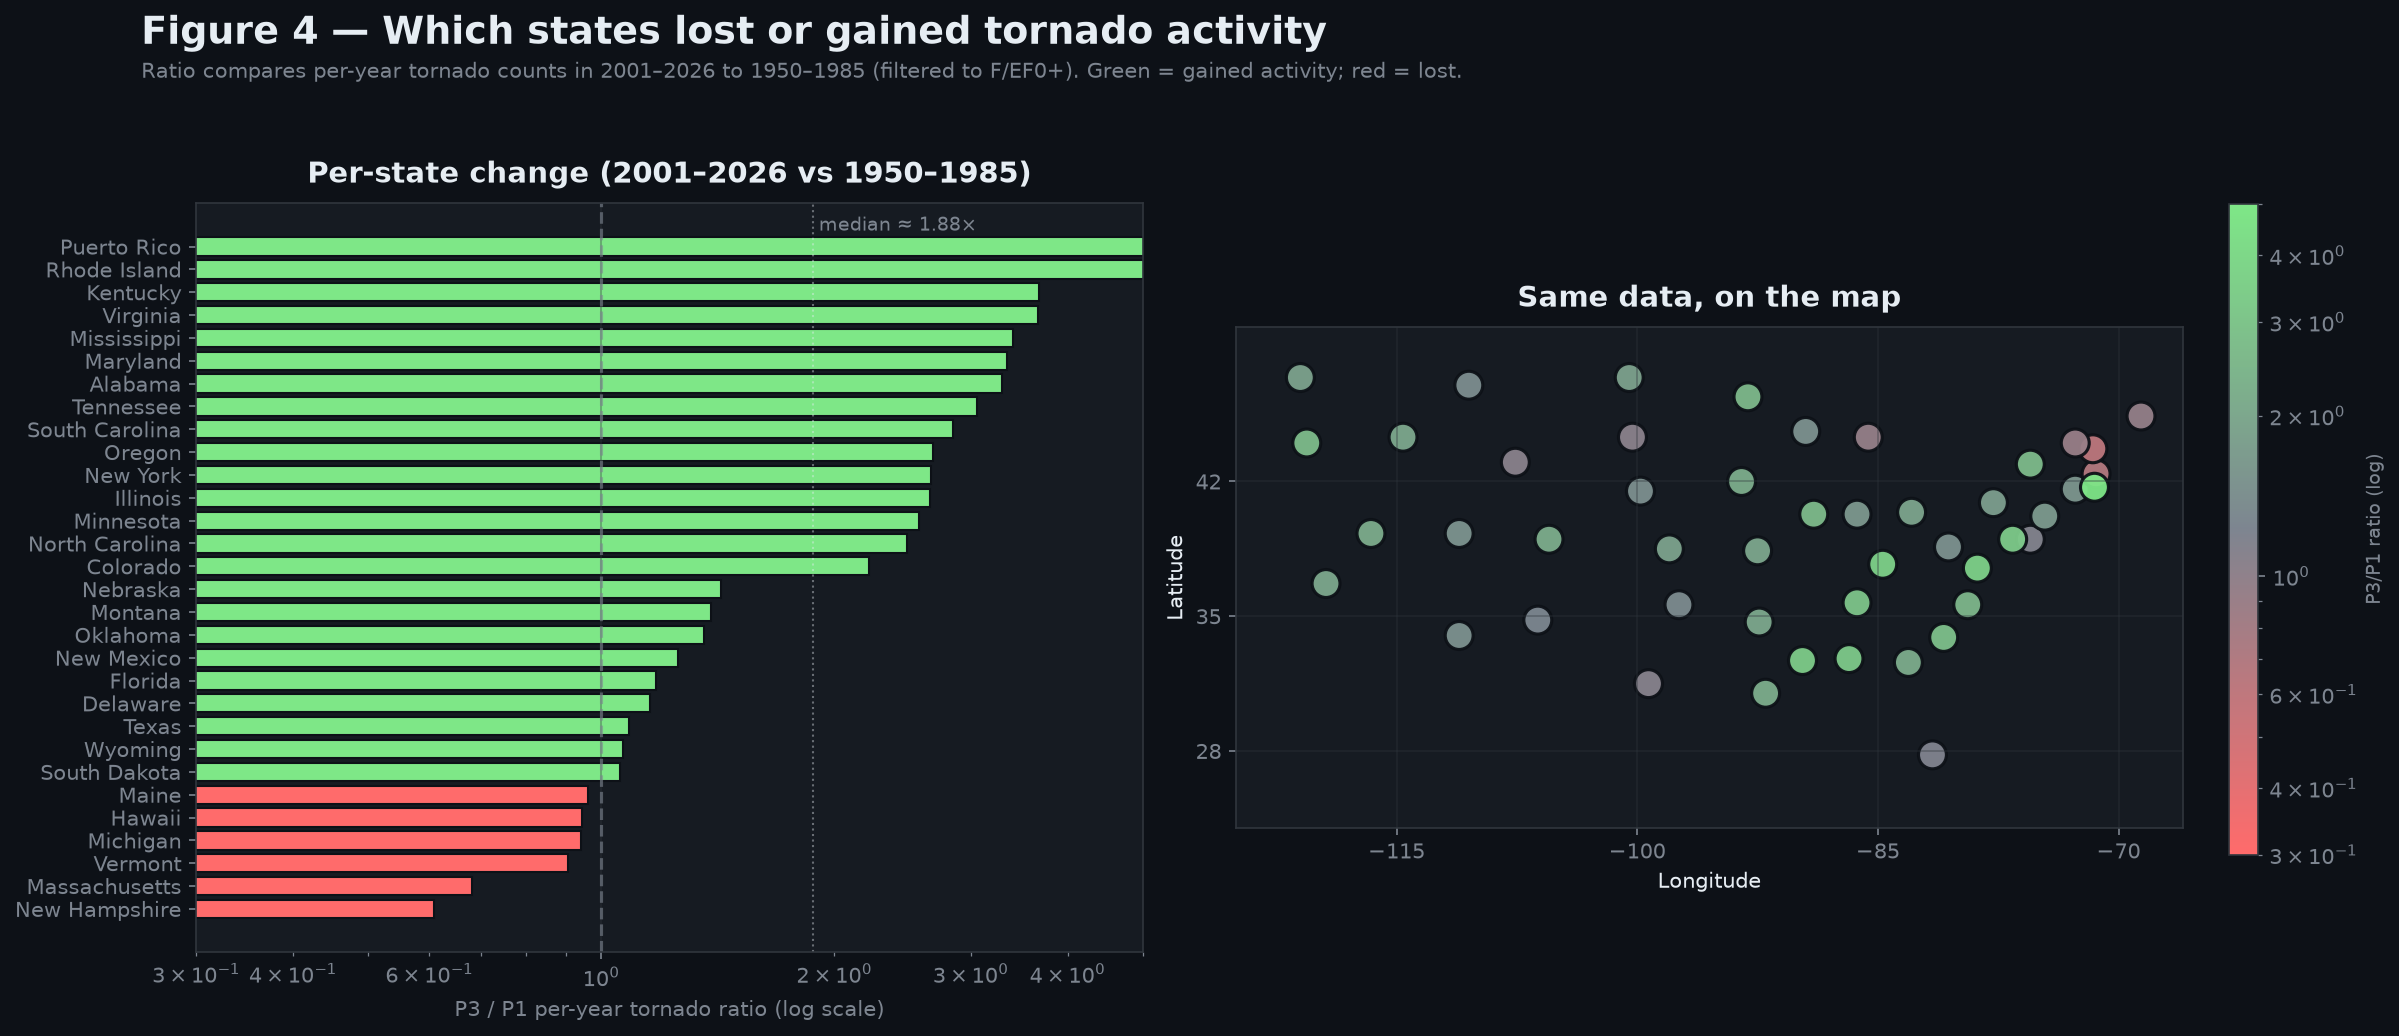
10 states gained; 10 states lost

The ratio-of-ratios: P3 (2001–2026) per-year mean ÷ P1 (1950–1985) per-year mean, filtered to F/EF1+ and only over states with at least 200 significant tornadoes across the full record.

The biggest gainer is Kentucky (2.81×); biggest loser Wyoming (0.50×). The table tells the migration story more precisely than any aggregate metric.

Top 5 gainersP1/yrP3/yrRatio
KentuckyEF1+ tornadoes8.724.52.81×
MississippiEF1+ tornadoes20.953.02.54×
VirginiaEF1+ tornadoes4.210.12.4×
New YorkEF1+ tornadoes2.55.82.28×
AlabamaEF1+ tornadoes20.644.42.16×

Top 5 losersP1/yrP3/yrRatio
WyomingEF1+ tornadoes4.72.40.5×
ColoradoEF1+ tornadoes10.95.60.51×
MichiganEF1+ tornadoes13.17.00.53×
TexasEF1+ tornadoes73.342.70.58×
FloridaEF1+ tornadoes24.014.80.62×
Per-state tornado change ratio: P3/P1, log scale
Fig. 4 — Per-state gain/loss, EF1+ tornadoes, log scale
// §6 — the headline claim, restated

The Tornado Alley narrative has been wrong for 20 years

NOAA and academic meteorology have spent two decades publishing maps that look like Texas. The data argues those maps should now look like a corridor along the Mississippi River — starting at the Arkansas/Louisiana border, running through Tennessee, Kentucky, and into southern Indiana and Ohio. The activity hasn't disappeared; it has moved.

What this paper offers: a precise quantitative description of that shift (a 70-mile east centroid migration, a 2.7× Southeast gain, a still-flat Plains), grounded in the entire NOAA Storm Events record from 1950 to 2024 and reproduced from the data shipped with this site.

// figure index — 8 visual summaries

Cover gallery

Annual-trend series, seasonal split, intensity mix, casualty timeline, and the centroid migration arrow. All built in matplotlib from the same parquet.

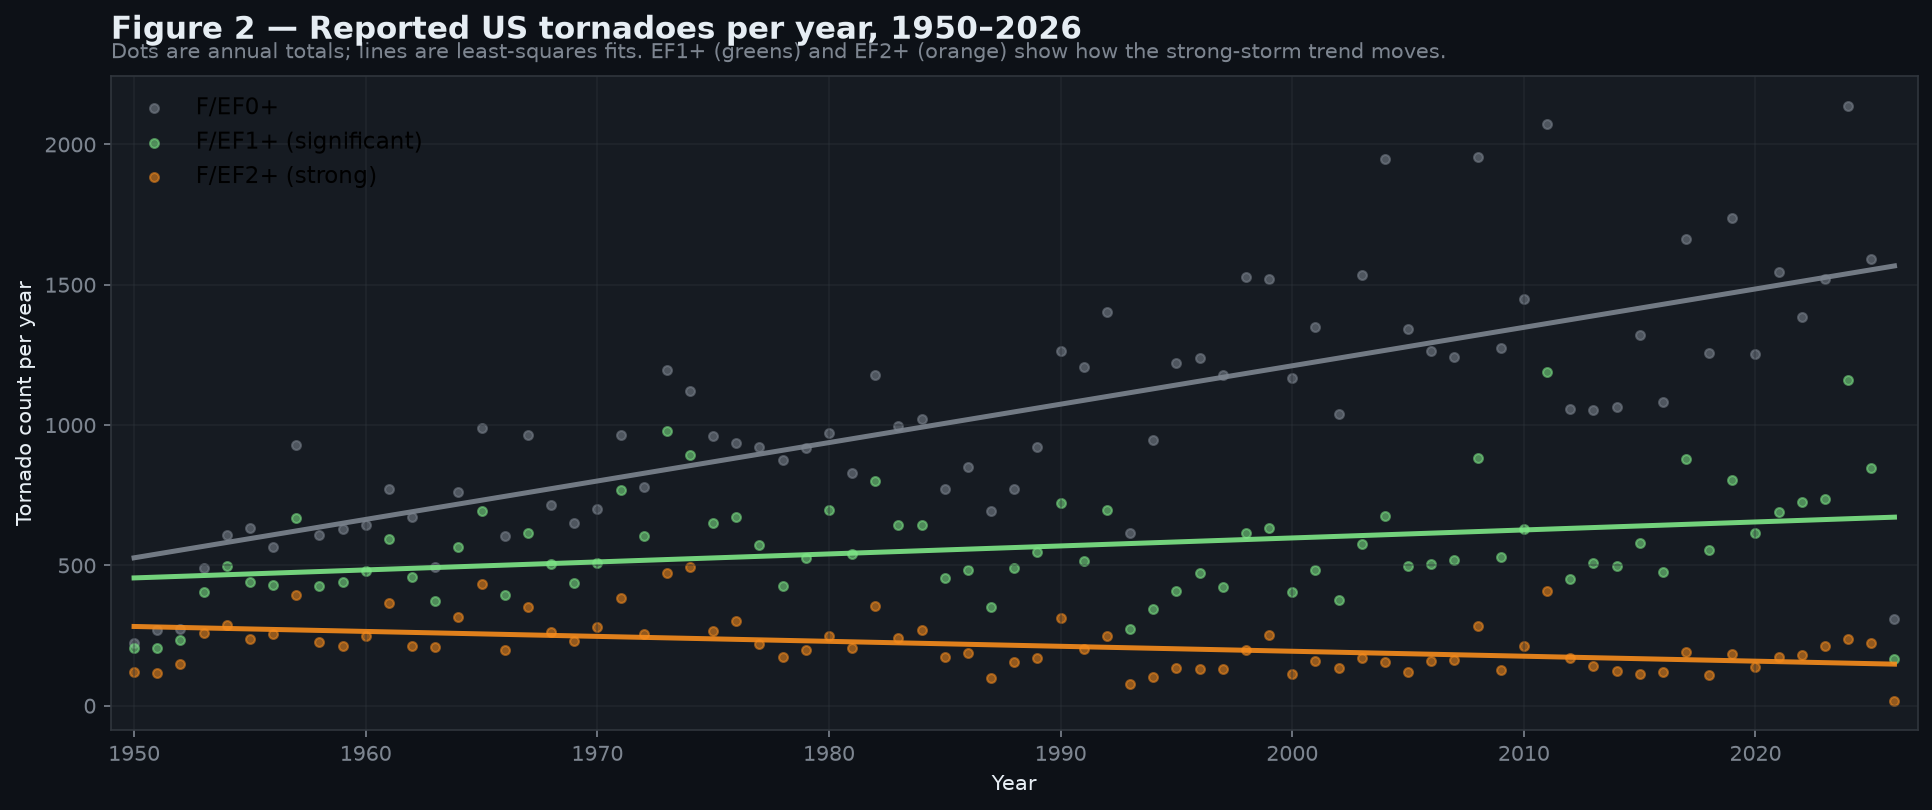
Annual reported tornado count by intensity tier
01Trend · annual EF0+/1+/2+
Great Plains vs Southeast per-year counts, three eras
02Region · per-yr by era
State-by-state tornado change ratio
03State · gain/loss ratio
Annual tornado count by season with trend lines
04Season · annual trends
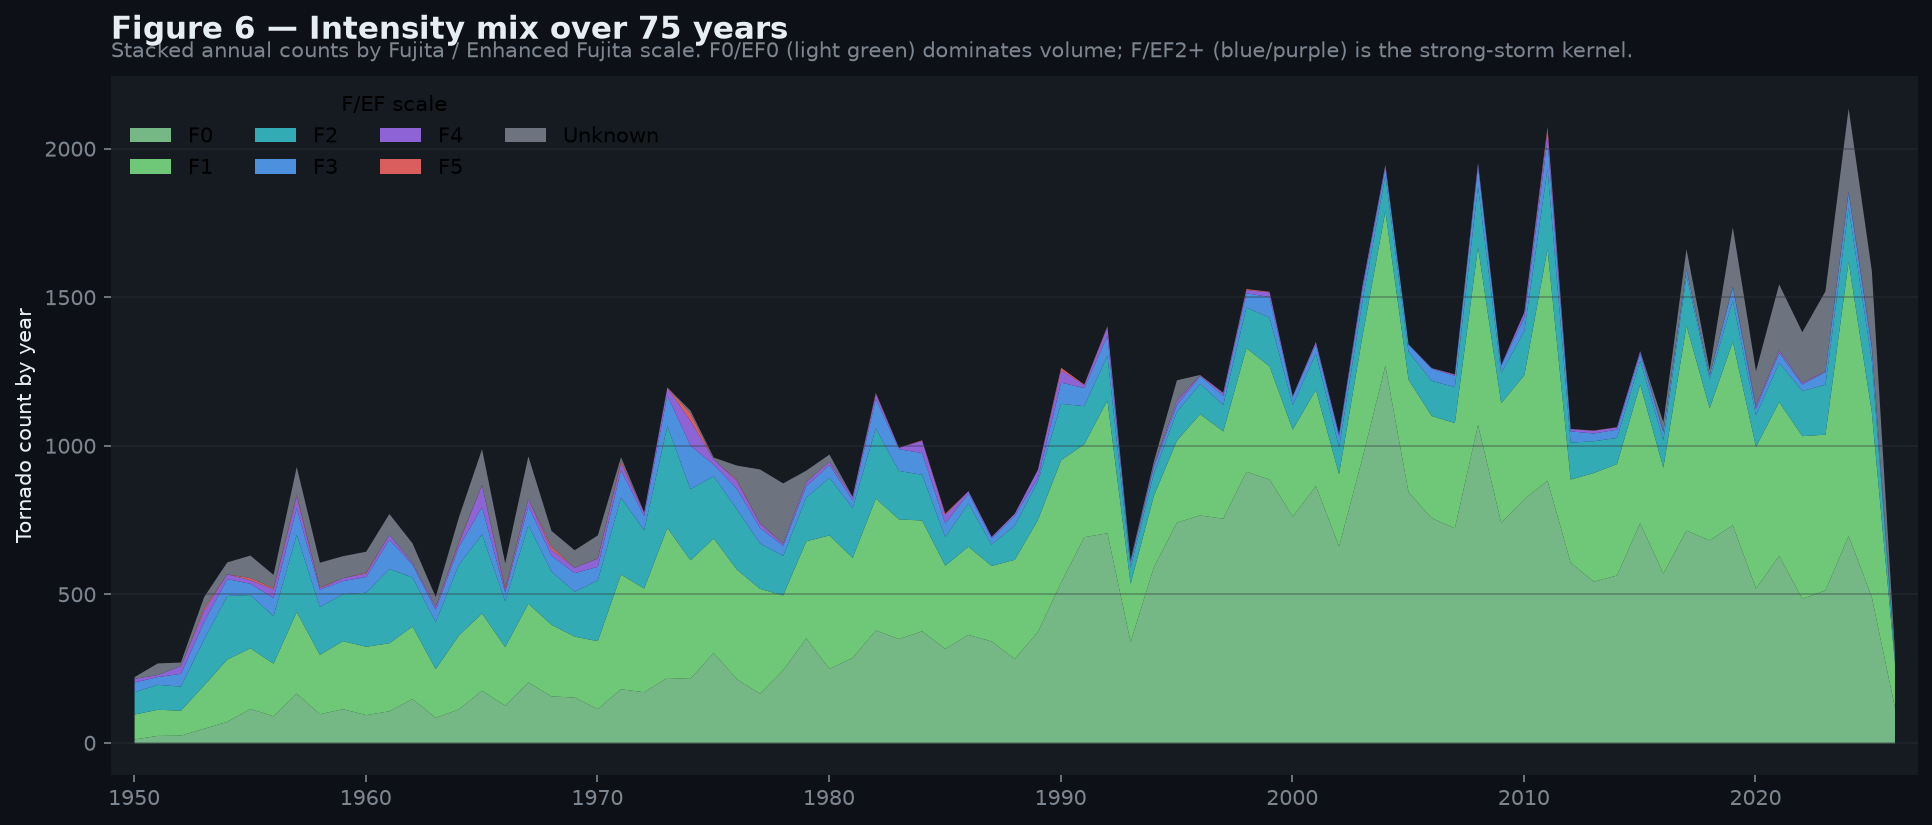
F/EF scale distribution over time
05Intensity · scale mix
Tornado deaths and injuries per year
06Casualties · death toll
Seasonal share of annual tornadoes by era
07Season mix · by era
Centroid arrow map, 1950→2026
08Centroid · eastward shift